Hospital administrators and providers may feel like they are pulling a train uphill because they are constantly under pressure to improve profitability. There are many issues facing administrators and providers such as improved patient outcomes, increased reimbursement, and decreased expenses.
To improve profit margins, either patient volume must increase, or costs must decrease, or both occur. The Affordable Care Act (ACA) reduced the annual increases in Medicare payment rates to hospitals, however the ACA also mandated people obtain health insurance. The intended effect, at the time, was to improve the financial health of hospitals by increasing patients with insurance thus reducing the amount of care that hospitals provide to uninsured patients.
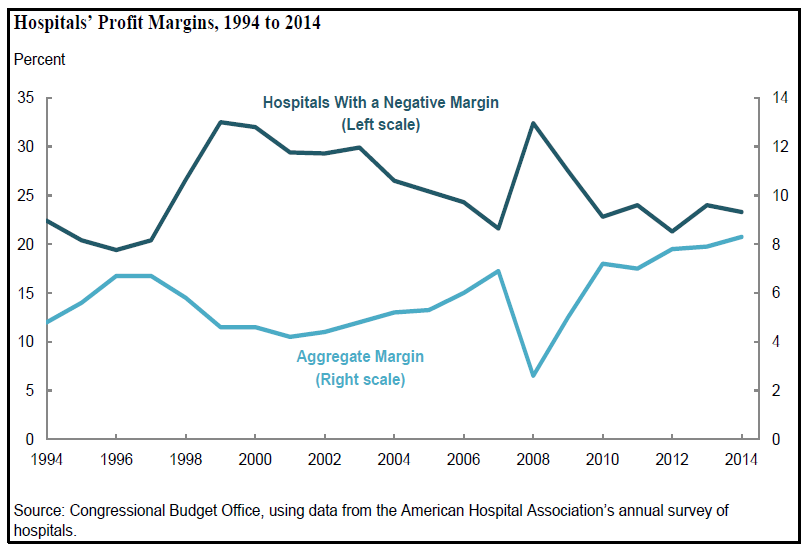
However, according to recent research by Moody’s Investors Service1, public and Not-For-Profit hospital expenses are growing faster than revenues. In 2017, hospital expenses increased 5.7% while revenues increased 4.6%. The U.S. Congressional Budget Office reported aggregated hospital net margin is roughly 8%, though roughly 23% of hospitals have negative net margins. 2
Facing a suboptimal economic situation, how can hospital administrators increase revenue, control costs, and obtain optimal patient outcomes? Fortunately, there are three steps that healthcare administrators can take to improve the economic position of their hospital or medical practice: identify care variation, risk adjust patients, and measure patient outcomes.
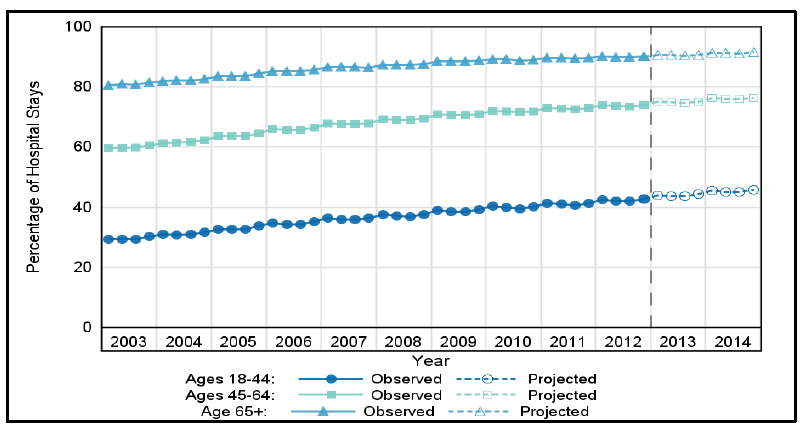
The first step is to identify the variation of care delivered. Even at the highest rated organizations, there is significant variation in healthcare costs and patient outcomes. Current healthcare cost accounting systems do an adequate job generating reports of average costs of patient care, provider and resource utilization, and other high level reports. However, these reports can give healthcare administrators a false sense of security. While these reports allow for comparisons of cost and resource utilization among providers, the reports do not account for case severity and complexity. Higher acuity patients who are at least 65 years old dominate inpatient stays. According to the Department of Health and Human Services 3, the percentage of inpatient hospital stays from 2003 – 2014 among adults with multiple chronic conditions has been dominated by patients who have CMS as the payer.
Patient volume will increase in the coming years as the baby boomer generation reaches the age of 65 and naturally, the costs to treat these patients will increase. Hospital administrators should first determine where the cost variations occur in order to make appropriate risk-adjustments.
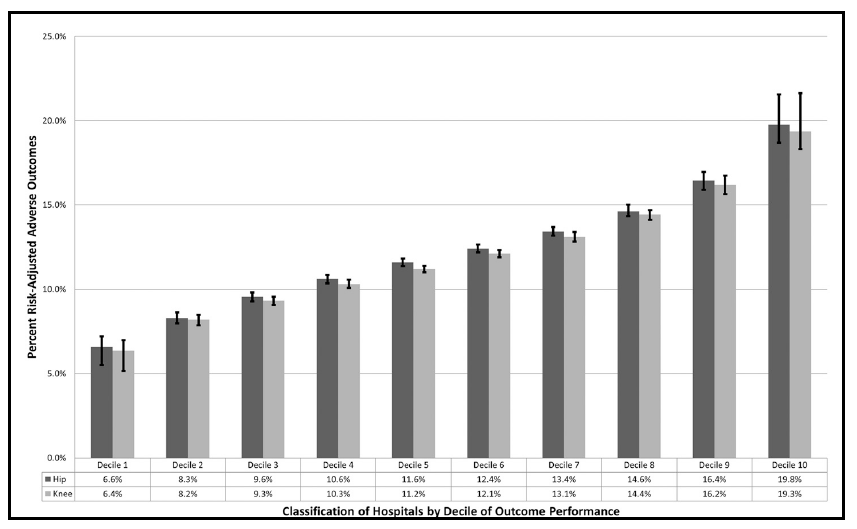
The second step to improve the economic position is to risk-adjust the patients receiving medical care. Not every patient undergoing a total joint replacement will require the same cost of care to obtain an optimal outcome. As such, patients must be risk-adjusted in order to appropriately compare health outcomes. A patient’s relative costliness is based on several factors such as age, sex, comorbidities, and previous treatments. If a healthcare administrator can identify, and weight a patient’s risk factors, then a likely treatment cost and outcome can be determined. Dr. Donald Fry M.D. and his colleagues investigated the variance of outcomes of nearly 1 million patients who underwent elective total joint replacement surgery at 2,349 U.S. hospitals4. In this study, they observed patient risk-adjusted outcomes exceeded 10 standard deviations. In other words, they identified and adjusted every patient’s risk, compared the outcomes (such as readmission, ED visit, and mortality), and observed a significant variability in outcome as shown in the chart below.
The third step to improve the economic position of a healthcare organization is to measure a provider’s patient population outcome. After risk-adjusting the patient population for each provider in the organization, then administrators can compare each patient’s outcome and the cost associated with episode of care. Administrators can compare outcome events across each provider on a normalized basis. These outcome events can be patient complications, hospital readmission, length of stay, ED admission post-discharge, etc. For each provider, healthcare administrators can calculate the aggregated patients observed outcomes and compare to an expected outcome. Once the basis of comparison is set, then administrators can begin discussions with the providers in the practice. For example, if Provider A has 250 episodes of care in a given year, and there are 30 observed adverse events (such as deaths, complications, or readmissions within 90 days) but, given the risk profile of the patients, there were
expected to be 20 adverse events, the administrator can discuss with the provider and look more into the cases where the cost of treatment exceeded the expected cost.
The goal of any healthcare provider is to deliver optimal care at the lowest cost possible with the highest patient satisfaction. Healthcare administrators need to understand the patient severity in order to measure appropriateness of the care delivered. Provider overutilization may be indistinguishable from appropriate utilization in cases that develop complications because of the patient’s risk profile. As such, administrators may waste resources trying to address perceived utilization problems. If healthcare administrators and providers have a clearer picture of the variation of costs, why the variation exists, and adjust for the complexity of the case, then improved profitability will naturally follow. Hospital administrators and providers do not need to take shortcuts or use brute force to pull train over the top but focus on one issue at a time and eventually momentum will take over. When this occurs, they can address on other crucial areas such as improving hospital food.
______________________
1 Moody’s Investors Service, Inc “Moody’s – US NFP & public hospitals’ annual medians show expense growth topping revenues for second year” August 28th, 2018. https://www.moodys.com/research/Moodys-US-NFP-public-hospitals-annual-mediansshow-expense-growth–PBM_1139331
2 Congressional Budget Office working paper series “Projecting Hospitals’ Profit Margins Under Several Illustrative Scenarios” Working Paper 2016-04
3 Agency for Healthcare Research and Quality (AHRQ), Center for Delivery, Organization, and Markets, Healthcare Cost and Utilization Project (HCUP), State Inpatient Databases (SID), 2003–2012, and early State discharge data, 2013
4 Fry DE, Pine M, Nedza S, Locke D, Reband A, Pine G. Risk-Adjusted Hospital Outcomes in Medicare Total Joint Replacement Surgical Procedures. J Bone Joint Surg Am. 2017 Jan 4;99(1):10-18.